
Contents
- 1 How Live Dashboards Replace Manual ITSM Reporting in Excel
- 1.1 Introduction: The Problem with Manual Excel Reporting
- 1.2 What Are Live ITSM Dashboards?
- 1.3 Key Benefits of Live Dashboards Over Excel
- 1.4 How Anakage Live Dashboards Transform ITSM Reporting
- 1.5 Practical Use Cases
- 1.6 The Bigger Picture: From Reactive Reporting to Proactive ITSM
- 1.7 Conclusion
- 1.8 FAQs
How Live Dashboards Replace Manual ITSM Reporting in Excel
Live ITSM dashboards replace manual Excel reporting by providing real-time, auto-refreshing visibility into tickets, SLAs, and MTTR. Unlike static spreadsheets, which require exports and manual updates, dashboards unify data into a single source of truth. This reduces reporting effort, eliminates human error, and empowers IT leaders to act proactively instead of reactively.
Introduction: The Problem with Manual Excel Reporting
For decades, Excel has been the go-to reporting tool for IT teams. It’s familiar, widely available, and seemingly flexible. But beneath this convenience lie inefficiencies. IT managers spend hours every week exporting data, creating pivot tables, and emailing reports – only to end up with outdated, error-prone snapshots of IT performance.
The impact is costly. Reporting delays hinder decision-making, SLA breaches go unnoticed until it’s too late, and IT leaders struggle to gain a holistic, real-time view of operations. According to Gartner, up to 20% of IT managers’ time is spent on manual reporting tasks, time that could otherwise drive strategic initiatives.

What Are Live ITSM Dashboards?
Live dashboards are dynamic, self-refreshing visualizations built directly into modern ITSM platforms. They eliminate manual exports and provide a continuously updated view of critical metrics like ticket volumes, SLA adherence, MTTR, backlog trends, and endpoint anomalies.
Unlike static Excel spreadsheets, live dashboards present IT performance as it happens, enabling decisions in minutes rather than days.
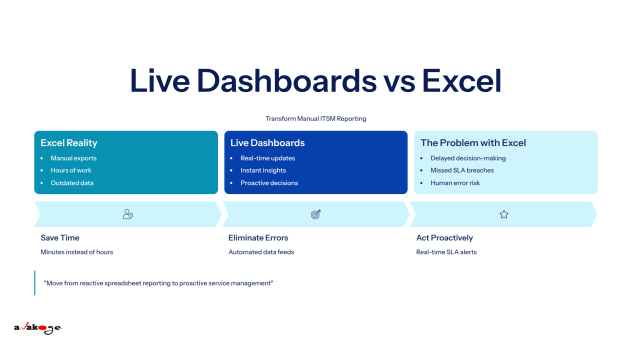
Excel vs. Live Dashboards: A Quick Comparison
| Aspect | Excel Reporting | Live Dashboards |
|---|---|---|
| Data freshness | Manual exports | Real-time auto-refresh |
| Error risk | High (manual inputs, macros) | Low (automated feeds) |
| Visibility | Siloed worksheets | Unified ITSM data view |
| Decision-making | Delayed, reactive | Immediate, proactive |
Key Benefits of Live Dashboards Over Excel
1. Time Savings
- No repetitive data pulls or pivot table setups.
- IT leaders access always-updated dashboards in seconds.
- Reduces weekly reporting cycles from hours to minutes.
2. Accuracy and Consistency
- Removes human error from formulas and version mismatches.
- Ensures stakeholders see the same real-time dataset.
3. Proactive Incident Management
- Automated SLA breach alerts trigger before thresholds are missed.
- Endpoint anomalies (e.g., disk full, AV inactive) generate tickets instantly.
4. Unified IT Visibility
- Centralized view across incidents, requests, automations, and asset health.
- Improves cross-team collaboration by eliminating silos.
5. Business Agility
- Faster, data-driven decisions.
- Enables IT to align with business goals in real-time instead of reporting on “last week’s problems.”
How Anakage Live Dashboards Transform ITSM Reporting
Anakage takes live dashboards beyond visualization – integrating them tightly with automation, anomaly detection, and ticketing.
- Self-refreshing dashboards: Data updates in real-time, no exports needed.
- Unified ticket view: Incidents from bots, automations, or asset monitoring in one place.
- SLA & MTTR tracking: Compliance metrics visible at all times.
- Historical insights: Visualize backlog patterns, inflow trends, and SLA performance.
- Out-of-the-box readiness: Deploy in days, without consultants or BI tools.
“With Anakage, IT leaders move from reactive spreadsheet reporting to proactive service management — saving time and driving business value instantly.”
Practical Use Cases
- CIO Dashboard: Enterprise-level SLA performance and compliance for board reporting.
- IT Manager Dashboard: Real-time backlog, ticket inflow, and MTTR visibility.
- System Administrator Dashboard: Endpoint anomaly alerts, disk usage, AV activity.
- Service Desk Manager Dashboard: Workload balancing and agent performance tracking.
Each use case replaces what used to take hours of Excel consolidation with instant, auto-updated insights.
The Bigger Picture: From Reactive Reporting to Proactive ITSM
Excel belongs to a world of reactive reporting — static, backward-looking, and labor-intensive. Live dashboards, by contrast, represent a lightweight and intelligent ITSM approach: proactive, real-time, and insight-driven.
By eliminating manual reporting bottlenecks, IT teams gain agility and can focus on improving Digital Employee Experience (DEX), ensuring faster resolutions and higher employee satisfaction.
Conclusion
Manual Excel reporting is no longer fit for modern IT operations. Live ITSM dashboards deliver real-time accuracy, agility, and visibility that spreadsheets simply cannot match.
This shift from manual reporting to intelligent dashboards is a core pillar of lightweight and intelligent ITSM, as explored in our broader guide: [ A Practical Guide to Lightweight & Intelligent IT Service Management ].
Ready to see a more intelligent approach to ITSM?
[Schedule a Personalized Demo Today]
Have you read about our last release? Click here to read!
FAQs
- Q: Why is Excel reporting a problem for ITSM?
A: Excel requires manual exports, consolidations, and updates, making it slow, error-prone, and outdated by the time reports reach decision-makers. This delays responses and hides SLA breaches. - Q: How do live dashboards improve ITSM reporting?
A: Live dashboards auto-refresh with real-time ITSM data, centralize incidents, and provide instant SLA/MTTR visibility. They eliminate repetitive reporting cycles, reduce human error, and support proactive incident management. - Q: Can live dashboards fully replace Excel?
A: Yes, for ITSM reporting. While Excel may remain useful for ad-hoc analysis, live dashboards deliver a single source of truth, ensuring accuracy, visibility, and speed for IT leaders. - Q: What makes Anakage dashboards unique?
A: Anakage dashboards come out-of-the-box, require no BI tools or consultants, and unify tickets from bots, automations, and endpoint anomalies — features many ITSM platforms only achieve with complex integrations.